|
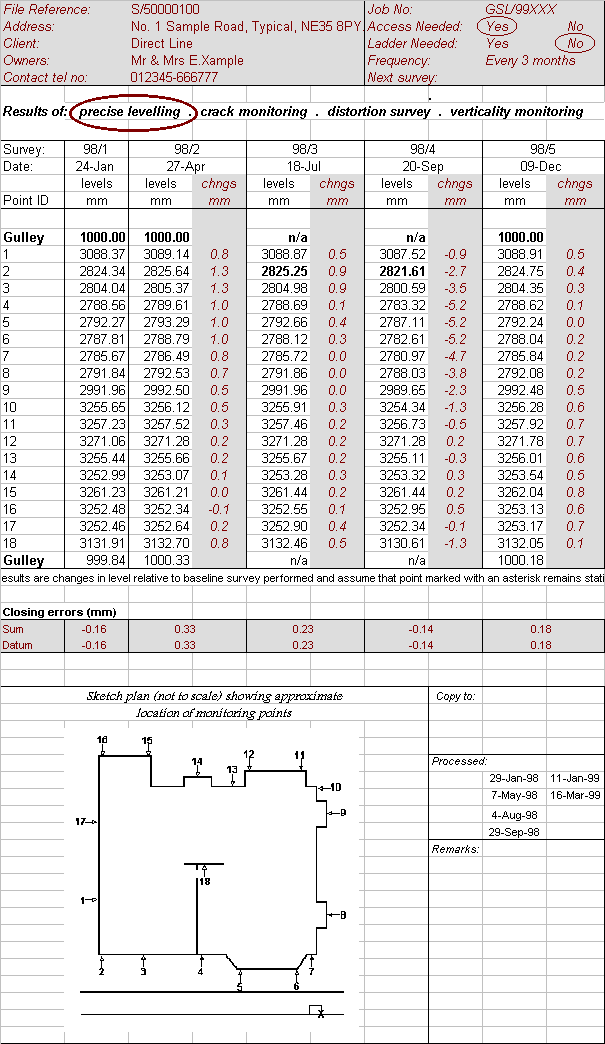
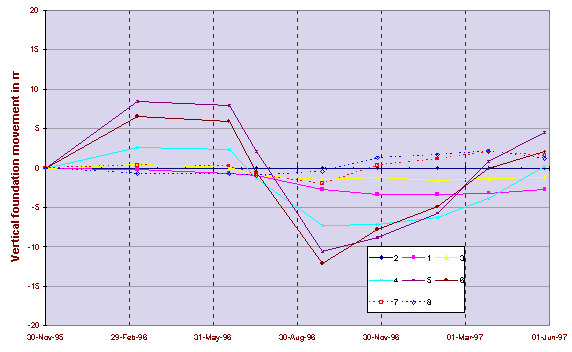
As shown by the examples of the spreadsheet (fig 1a) and graph (fig 1b), below, it is possible to list all the results / graphs (clearly) of any policy holders properties across the internet on the day of processing data, via a database of results (using Microsoft FrontPage 2000�s Database Results Wizard) fast data access can be provided. Restrictions to access of personnal information can be maintained via passwords and other forms of security details. |


